Sachu Technologies offering Flicker Analysis and it refers to variations in brightness due to small voltage fluctuations. They are known in form of spikes, swells and surges. Flicker has been a problem in electrical networks from their inception.It is very common power quality problem in a network. It can cause lot of software and hardware problems. They is normally very hard to detect as occur for very short period. Voltage flicker or fluctuation is again a very common phenomenon witnessed in many networks causing damage to equipment in Network.Studies are conducted to check the level of these in network and subsequently to offer solutions and remedy for the same. Flicker can be defined as small amplitude changes in voltage levels occurring at frequencies less then 25 Hertz (25Hz). Flicker is caused by large, rapidly fluctuating loads such as arc furnaces and electric welders.Flicker is rarely harmful to electronic equipment, but is more of a nuisance because it causes annoying, noticeable changes in lighting levels.
 |
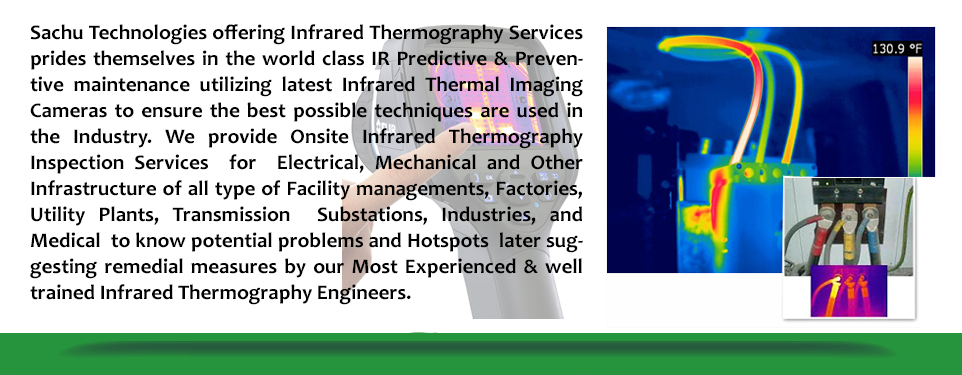
Random or repetitive variations in the voltage. Caused by e.g. mills,arc furnaces welding equipment and shredders. Flicker is defined as 'Impression of unsteadiness of visual sensation induced by a light stimulus whose luminance or spectral distribution fluctuates with time'. Or in other words, voltage fluctuations on the supply network cause change of the luminance of lamps, which in turn can create the visual phenomenon called flicker. Above a certain threshold it becomes annoying to people present in a room where the flicker exists. The degree of annoyance grows very rapidly with the amplitude of the fluctuation.
Power-line flicker is a visible change in brightness of a lamp due to rapid fluctuations in the voltage of the power supply. The voltage drop is generated over the source impedance of the grid by the changing load current of an equipment or facility. These fluctuations in time generate flicker. The effects can range from disturbance to epileptic attacks of photosensitive persons.
These fluctuations are caused by the operation of various types of equipment connected to the network, such as arc furnaces, welding machines, motors, etc. These are due to loads which cause permanent power demand variations. In some conditions, it has been shown that the presence of interharmonics in the power supply voltage also causes flicker. These variations can be viewed easily because their spectral breakdown is located in a band from 0.5 Hz to 25 Hz.
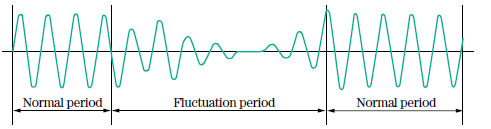
To investigate the consequences of this phenomenon were public health and safety organizations, because lighting affected by flicker causes both physical and psychological fatigue among users. The closer the lighting is to a load generating disturbances, the more severe the flicker becomes. Furthermore, flicker mainly affects incandescent lighting. Its severity varies according to the type of light source. Discomfort is proportional to the square of the amplitude and the duration of the voltage fluctuations - people's average sensitivity to lighting flicker is highest at a frequency of 8.8 Hz So, to find out whether the voltage is correct or not, the following parameters must be checked: - The voltage variation - The repetition rate
Measurement of Flicker
The requirements of a flicker measurement equipment are defined in the international electro-technical standard IEC 61000-4-15. IEC 61000-4-15 This standard specifies all the features which must be offered by any instrument intended for accurate flicker measurement with all the fluctuation waveforms encountered in practice. The applicable standards define the acceptable range for these voltage variations: period < 1 hour, low amplitudes (< 10 %) of the power supply voltage.
For periodic signals the percent flicker is defined as:
 |
A flicker meter is composed of several function blocks which simulate incandescent lamp and the human perception system.From the resulting momentary value of flicker the short term flicker "perceptibility" value Pst is calculated according to a statistical process over a standardized 10-minute observation interval. Long term flicker Plt is calculated as the cubic mean of several Pst values over a standardized two-hour period.
The perceptibility value calculation and scaling algorithm were chosen such that a P value of 1.0 corresponds to a level at which 50% of test subjects found the flicker to be both noticeable and irritating.In the standard IEC 61000-3-3 the observation intervals and the limiting values for Pst and Plt are specified:
Value Observation Interval Limiting Value
Pst 10 min 1.0 Plt 2 h 0.65