
What Is Infrared Thermography ?
All objects Emit heat. Infrared Thermography uses an infrared camera to see infrared heat waves and measure their temperature. Temperatures cooler than that are emitted as infrared waves. An infrared camera detects temperatures in this lower range and produces colorized images which enable us to see the temperature variations in the Thermal image.
Thermography provides a safe and fast way to inspect the condition of a facility's electrical, mechanical, and structural integrity. It has been widely recognized as an indispensable tool in preventive maintenance and Predictive maintenance .
Why is Infrared Thermography important to a Total maintenance Program
Is Infrared Thermography for me?
As a maintenance professional, if you are under task to keep your facility or utility reliable, with zero unexpected breakdowns, and zero catastrophic failures, then you will find infrared Thermography is an indispensable tool in a total maintenance program.
Why Outsource Infrared Thermography Services
Why Sachu Technologies infrared services ?
How Power Quality Problems Affects You ?
Causes of Poor Power Quality and PQ problems
can be traced to three origins – Upstream supply, internal distribution, or internal loads. Internal Distribution 80% of all power quality problems occur in a company’s distribution and grounding/bonding systems. Corroded connections, defective conduit, defective electrical devices, improper wiring, overloading circuits and improper bonding.Internal Loads Everything from variable speed drives, microprocessor based devices, and loads such as lighting and battery chargers contribute to the resulting quality of electrical power in a circuit. Internal loads can cause poor power factor, harmonics and power quality events such as sags, swells, and transients.
Why Measure Power Quality?
Power Quality (PQ) refers to the reliable delivery of electrical energy in a form that enables electrical equipment to operate properly. When dips and swells, spikes, surges, momentary outages, sags or other disturbances occur – computers and other electrically powered equipment may malfunction, fail prematurely or shut down unexpectedly. Many facilities simply cannot accept these consequences. Consider hospitals, banks, data communications centers, manufacturing and other facilities that rely on smooth, reliable power for operations. The consequences of an unplanned outage can cost thousands of dollars each minute or result in unsafe conditions or other serious problems
Why We Require Power Quality Analysis ?
PQ disturbances in network are caused due to following key three factors
Non-linear loads on consumer side,Power electronic loads arc furnaces and induction heating systems Switching on or off of large loads, etc,Transmission, Transformer energization or feeder capacitor switching, Equipment failure because of poor O&M,Natural Causes,Faults or lightning strikes on transmission lines or distribution feeders, Falling of trees or branches on feeders during stormy weather conditions
Power Quality Audit Check List
Solving Power Quality Problems in India ,Hyderabad,Chennai,Pune,Bangalore ,Visakhapatnam
Sachu Technologies Team identify the source and nature of the disturbance or condition that is causing the problem. This usually involves interviews with facility personnel and making a variety of measurements using power monitoring equipment. Based on the source and nature of the problem, alternative solutions are developed. Typical solutions may involve installation of an uninterruptible power supply (UPS), design and installation of filters, removing the external source of interference or the answer might be as simple as transferring the load to another circuit or reconnecting an improperly connected ground or neutral conductor
What are Harmonics?
The term harmonics commonly refers to a distortion of the normally smooth utility power. Harmonics are actually higher frequency voltages and currents and when added to the utility power, produce a distortion of the normal voltage or current waveform. Usually, harmonic distortion must be present continuously to have an adverse effect on the power system.
Symptoms of Harmonics Studies in India ,Hyderabad,Chennai,Pune,Bangalore, Visakhapatnam ,India
Causes of Harmonics
Harmonics are produced by "non-linear" loads in power systems. A non-linear load does not draw current in proportion with the applied 60 Hertz sinusoidal voltage waveform. In other words, this equipment "gulps" electric current from the supply rather than taking current in a smooth fashion.
Harmonic-producing non-linear loads comes from devices with power electronics such as:
Symptoms of Harmonics
In small quantities, harmonics are of little concern. However, too many non-linear loads in your facility can lead to significant power quality problems. Main issues caused by Harmonics in the network systems
Effects of Harmonics
Increased losses and temperature rise in Cables & Transformers,Resonance between inductance and capacitance of the network resulting in amplification of harmonic currents in the network,Accuracy of measuring instruments and protection relays affected . Communication signals distorted. Increase in Eddy Current and Hysteresis Losses. Increase in Noise level of Audio equipment. Buss Bar Humming Noise,Increase in neutral currents. Neutral conductor and terminal failures. Failure of electromagnetic loads.
A Harmonic Study will:
Typical scope of Electrical Safety study
Methodology
Electrical Safety Audit in India, Hyderabad, Chennai, Bangalore , Pune ,Viskhpatnam consists of Studying, Assessing, Measuring and Analyzing electrical utilities. In a typical Plant the electrical utilities consists of
Key Objectives of Energy Auditing in India ,Hyderabad, Visakhapatnam, Pune ,Chennai,Bangalore
Displacement Power Factor
The displacement power factor is the power factor due to the phase shift between voltage and current at the fundamental line frequency. For sinusoidal (non-distorted) currents, the displacement power factor is the same as the apparent power factor.Inductive loads cause current to lag behind voltage, while capacitive loads cause current to lead voltage
Why Perform Power Factor Testing?
Most failures of electrical equipment are the result of a breakdown in the insulation system. Power factor testing is an effective way to detect defective electrical equipment insulation. Power factor is the ratio of the capacitive or ‘charging’ current (measured in voltamperes) to resistive or ‘leakage’ current (measured in watts). It is a means of measuring insulation integrity since the smaller the power factor, the better the insulator. Insulation may be deteriorating, however, the equipment may not fail for some time. Although this condition represents a serious hazard, if deteriorated insulation is detected before failure, it can often be reconditioned instead of being replaced. This allows corrective action to be taken during a planned outage before extensive equipment damage results from insulation failure. Power factor testing also makes it possible to detect equipment insulation problems without making an internal visual inspection. The result is a significant decrease in maintenance cost and downtime. Power factor testing is one of the best testing techniques for predictive and preventive maintenance
A power factor study is a key to properly determining a system’s power factor correction requirements. A study determines capacitor size and location as well as the number of steps and incremental sizes to be switched. A study also provides an economic analysis of the proposed installation based on the forecast reduction in electric utility bills. A power factor study can be divided into three major steps.The power factor study begins with a utility rate structure review together with a historical sample (six to 24 months) of electric bills. This information is used to evaluate present use patterns and to determine the potential economic benefits of improving power factor. Utility rate structures usually provide significant economic incentives to reduce total kVA demand. The taken data is used to develop the graphical profile which is plotted with respect to time to provide a representation of a complete operating cycle. This profile can then be used to determine the required kvar of capacitors necessary and the number of Switching steps to offset the inductive kvar.The minimum reactive kvar determine the amount of capacitors that can be used without switching to provide close to 100 percent power factor during minimum load conditions. Additional capacitor requirements can be determined based on the profile and sized as needed. Capacitance is introduced into the facilities electrical distribution system to balance inductance due to equipment operation. When equipment load, and subsequently inductance decreases, capacitance also should be reduced. For more erratic demand patters, more switching steps may be required. Sources of Transients
Effects of Transients
Motors
Lights
Electrical Equipment
Damages due to such PQ problems are uncommon as compared to voltage sags and interruptions, but when it does occur it is more destructive. To protect against transients, end-users may use Transient Voltage Surge Suppressors (TVSS), while utilities install surge arresters.
Furthermore, transients are classified as:
Transients Synopsis
Magnitude: Several thousands of volts and amps
Duration: <50 ns to 50 ms
Source: Lightning and switching activities
Symptoms: Electronic component damage
Occurrence: Low
Transients are sudden but significant deviations from normal voltage or current levels. Transients typically last from 200 millionths of a second to half a second. Transients are typically caused by lightning, electrostatic discharges, load switching or faulty wiring. The sampling rate is a constant 256 samples per cycle. When a transient capture is started, each sample is compared to the sample from the preceding cycle. The preceding cycle defines the mid-point of a virtual tube and is used as reference. As soon as a sample is outside the envelope, it is treated as a triggering event; the representation of the transient is then captured by the device. The cycle preceding the event and the three following cycles are saved to memory.
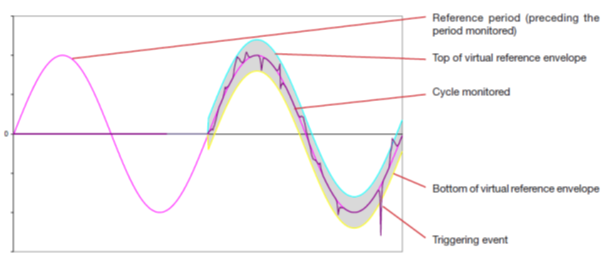 |
The half-width of the virtual envelope for the voltage and current is equal to the threshold programmed in the Transient mode of the configuration
Power Flow study involves measurement of
Active Power (KW), all phases & equivalent
The most important information obtained from the load flow analysis is the voltage profile of the system. If voltage varies greatly over the system, large reactive flows will result. This, in turn, will lead to increased real power losses and, in extreme cases, an increased likelihood of voltage collapse. When a particular bus has an unacceptably low voltage, the usual practice is to install capacitor banks in order to provide reactive compensation to the load. Load flow studies are used to determine how much reactive compensation should be applied at a bus, to bring its voltage up to an appropriate level. If new lines (or additional transformers) are to be installed, to reinforce the system, a power flow study will show how it will relieve overloads on adjacent lines. An inefficient or unbalanced load can also cause unpredictable behavior in your localized power grid, increasing the risk of equipment damage and unplanned outages.
It shall help to determine how the system will operate in normal cycle and emergency conditions and during different parts of day or Week. P.F compensation system, Automatic or fixed installed in the network are also checked for their effect in the network.
Load flow analysis has following advantages
Flicker Analysis
Random or repetitive variations in the voltage. Caused by e.g. mills,arc furnaces welding equipment and shredders. Flicker is defined as 'Impression of unsteadiness of visual sensation induced by a light stimulus whose luminance or spectral distribution fluctuates with time'. Or in other words, voltage fluctuations on the supply network cause change of the luminance of lamps, which in turn can create the visual phenomenon called flicker. Above a certain threshold it becomes annoying to people present in a room where the flicker exists. The degree of annoyance grows very rapidly with the amplitude of the fluctuation.
Power-line flicker in India ,Hyderabad,Chennai, Visakhapatnam, Pune ,Bangalore is a visible change in brightness of a lamp due to rapid fluctuations in the voltage of the power supply. The voltage drop is generated over the source impedance of the grid by the changing load current of an equipment or facility. These fluctuations in time generate flicker. The effects can range from disturbance to epileptic attacks of photosensitive persons.These fluctuations are caused by the operation of various types of equipment connected to the network, such as arc furnaces, welding machines, motors, etc. These are due to loads which cause permanent power demand variations. In some conditions, it has been shown that the presence of interharmonics in the power supply voltage also causes flicker. These variations can be viewed easily because their spectral breakdown is located in a band from 0.5 Hz to 25 Hz.
To investigate the consequences of this phenomenon were public health and safety organizations, because lighting affected by flicker causes both physical and psychological fatigue among users. The closer the lighting is to a load generating disturbances, the more severe the flicker becomes. Furthermore, flicker mainly affects incandescent lighting. Its severity varies according to the type of light source. Discomfort is proportional to the square of the amplitude and the duration of the voltage fluctuations - people's average sensitivity to lighting flicker is highest at a frequency of 8.8 Hz So, to find out whether the voltage is correct or not, the following parameters must be checked: - The voltage variation - The repetition rate
Measurement of Flicker
The requirements of a flicker measurement equipment are defined in the international electro-technical standard IEC 61000-4-15. This standard specifies all the features which must be offered by any instrument intended for accurate flicker measurement with all the fluctuation waveforms encountered in practice. The applicable standards define the acceptable range for these voltage variations: period < 1 hour, low amplitudes (< 10 %) of the power supply voltage.
A flicker meter is composed of several function blocks which simulate incandescent lamp and the human perception system.From the resulting momentary value of flicker the short term flicker "perceptibility" value Pst is calculated according to a statistical process over a standardized 10-minute observation interval. Long term flicker Plt is calculated as the cubic mean of several Pst values over a standardized two-hour period.he perceptibility value calculation and scaling algorithm were chosen such that a P value of 1.0 corresponds to a level at which 50% of test subjects found the flicker to be both noticeable and irritating.In the standard IEC 61000-3-3 the observation intervals and the limiting values for Pst and Plt are specified
Important Definitions related to Electrical Safety,Energy Audit ,Power Quality Services , Harmonic Study , Thermography, Thermovision Hotspot Scanning offering by Sachu Technologies
RMS
Peak values can be calculated from RMS Root mean Square values from the above formula, which implies VP = VRMS × √2
Active Power (P)
Alternative words Actual Power, True Power, Watt-full Power, Useful Power, Real Power
In a DC Circuit, power supply to the DC load is simply the product of Voltage across the load and Current flowing through it i.e., P = V I. because in DC Circuits, there is no concept of phase angle between current and voltage. In other words, there is no Power factor in DC Circuits. But the situation is Sinusoidal or AC Circuits is more complex because of phase difference between Current and Voltage.
In AC circuits, When circuit is pure resistive, then the same formula used for power as used in DC as P = V I.
Real Power formulas:
P = V I
P = VI Cosθ
P = √3 VL IL Cosθ
P = 3 VPh IPh Cosθ
P = √ (S2 – Q2)or
P =√ (VA2 – VAR2) or
Real or True power = √ (Apparent Power2– Reactive Power2) or
kW = √ (kVA2 – kVAR2)
Reactive Power (Q)
Also known as (Use-less Power, Watt less Power)
The powers that continuously bounce back and forth between source and load is known as reactive Power (Q).Power merely absorbed and returned in load due to its reactive properties is referred to as reactive power. .
Reactive power is given by Q = V I Sinθ which can be positive (+ve) for inductive, negative (-Ve) for capacitive load.
Reactive power
Q = V I Sinθ
Reactive Power=√ (Apparent Power2– True power2)
VAR =√ (VA2 – P2)
kVAR = √ (kVA2 – kW2)
Apparent Power (S)
The product of voltage and current if and only if the phase angle differences between current and voltage are ignored. Total power in an AC circuit, both dissipated and absorbed/returned is referred to as apparent power.The combination of reactive power and true power is called apparent power.In an AC circuit, the product of the r.m.s voltage and the r.m.s current is called apparent power.When the circuit is pure resistive, then apparent power is equal to real or true power, but in inductive or capacitive circuit then apparent power is greater than real or true power.
S = V I
Apparent Power = √ (True power2 + Reactive Power2)
kVA = √kW2 + kVAR2
Crest Factor
The crest factor is the ratio between the value of the peak current or voltage and its r.m.s. value..For a sinusoidal signal, the crest factor is therefore equal to .For a non-sinusoidal signal, the crest factor can be either greater than or less than .The crest factor for the current drawn by non-linear loads is commonly much higher than . It is generally between 1.5 and 2 and can even reach 5 in critical cases.A high crest factor signals high current peaks which, when detected by protection devices, can cause nuisance tripping.
K factor
KF application to transformers in the presence of harmonic currents.K-factor is a weighting of the harmonic load currents according to their effects on transformer heating K-factor of 1.0 indicates a linear load no harmonics.. The higher the K-factor, the greater the harmonic heating effects. When a non-linear load is supplied from a transformer, it is sometimes necessary to derate the transformer capacity to avoid overheating and subsequent insulation failure. The K-Factor is used by transformer manufacturers and their customers to adjust the load rating as a function of the harmonic currents caused by the load(s). Generally, only substation transformer manufacturers specify K-factor load de-rating for their products. So, for K-factors higher than 1, the maximum transformer load is de-rated.
There are some specific rules set by IEEE which must be followed before choosing a specific K-Factor value for a specific load. These include:
Harmonic loss factor
For the oversizing of transformers to allow for Harmonics.
Sags
Voltage Sag or Voltage Dipis as the decrease in the RMS voltage level to 10% - 90% of nominal, at the power frequency for durations of ½ cycle to one minute. Also, voltage sag is classified as a short duration voltage variation phenomena, which is one of the general categories of power quality problems.
Swells
Momentary increase of the voltage, at the power frequency, outside the normal tolerances, with duration of more than one cycle and typically less than a few seconds.
Voltage Unbalance
A voltage variation in a three-phase system in which the three voltage magnitudes or the phase-angle differences between them are not equal.
Very short interruptions
Total interruption of electrical supply for duration from few milliseconds to one or two seconds.
Long interruptions
Total interruption of electrical supply for duration greater than 1 to 2 seconds
Voltage spike
Very fast variation of the voltage value for durations from a several microseconds to few milliseconds. These variations may reach thousands of volts, even in low voltage.
Brownout
A brownout is an intentional or unintentional drop in voltage in an electrical power supply system. Intentional brownouts are used for load reduction in an emergency. The reduction lasts for minutes or hours, as opposed to short-term voltage sag
Oscillations /resonances
The flow of electrical energy, e.g. between the magnetic field of an inductor and the electric field of a capacitor, changes direction periodically.
Noise
Noise, or more specifically electrical noise, is a rapid succession of transients tracking up and down along the voltage waveform. The magnitude of these rapid transients is usually much less than that of an isolated transient. Noise often originates in electrical motors and motor control devices, electric arc furnaces, electric welders, relays, and remote atmospheric discharges such as lightning. Although less destructive than a large rapid transient, electrical noise can cause computers to malfunction and can interfere with the operation of communications equipment or other sensitive electronic equipment.
Power Factor
In AC circuits, the power factor is the ratio of the real power that is used to do work and the apparent power that is supplied to the circuit. The power factor can get values in the range from 0 to 1. When all the power is reactive power with no real power (usually inductive load) - the power factor is 0.
Energy
Energy is a measure of how much fuel is contained within something, or used by something over a specific period of time.The kWh is a unit of energy
Demand
Demand, measured in kilowatts (kW), is the maximum rate of electricity consumption over a billing interval. KWH is a measure of Energy whereas KW is a measure of Power
kWH, kVah, kVARh
KWH means kilo watt hours it is units of active energy consumption(active). these type of energy measurement is used for domestic loads.KVARH means kilo volt amperes reactive hours,units of reactive energy consumption, used in industries.KVAH means kilo volt ampere hours total energy consumption
Maximum Demand Indicator
MDI is an indication about the maximum load used by the consumer for the duration specific time in the given period. This parameter is significant both for consumer and the service company to decide the sanctioned load and also to plan the network capacity
Demand factor
Demand Factor is the ratio of the sum of the maximum demand of a system (or part of a system) to the total connected load on the system (or part of the system) under consideration. Demand factor is always less than one.
Power Factor
Power Factor is ratio of the actual electrical power dissipated by an AC circuit to the product of the r.m.s. values of current and voltage.
Displacement Factor
The displacement power factor is the power factor due to the phase shift between voltage and current at the fundamental line frequency
Power Factor Penalty
The power factor penalty is an incentive for the customer to pay attention to the power factor at their operation and consider installation of power factor correction capacitors rather than pay a penalty. Power factor correction can be tricky to calculate.
Total demand distortion
TDD is ratio of the root mean square of the harmonic content, considering harmonic components up to the 50th order and specifically excluding interharmonics, expressed as a percent of the maximum demand current. Harmonic components of order greater than 50 may be included when necessary.
Total harmonic distortion
THD is ratio of the root mean square of the harmonic content, considering harmonic components up to the 50th order and specifically excluding interharmonics, expressed as a percent of the fundamental. Harmonic components of order greater than 50 may be included when necessary.
Maximum demand load current
This current value is established at the point of common coupling and should be taken as the sum of the currents corresponding to the maximum demand during each of the twelve previous months divided by 12
Vunb
Negative-sequence phase-to-ground voltage unbalance rate.
Aunb
Negative-sequence current unbalance rate.